- Despite outshining BTC and ETH, SOL’s number of NFT sellers and buyers dropped.
- SOL was up by 4% in the last 24 hours, but a few metrics looked bearish.
Solana [SOL], which nowadays has been in the limelight for its high network activity, has once again made an achievement in the NFT ecosystem.
The blockchain has managed to outshine top players like Bitcoin [BTC] and Ethereum [ETH] on a key front. In the meantime, its price action has also turned bullish.
Solana’s promising NFT performance
SolanaFloor, a popular X handle that posts updates related to the blockchain’s ecosystem, recently posted a tweet highlighting an interesting development.
As per the tweet, Solana outshined all other blockchains in terms of daily NFT blockchain user adoption. SOL’s number increased by almost 34% in the last 24 hours. Apart from SOL, Polygon [MATIC] and Ethereum made it to the top three on the same list.
AMBCrypto’s look at DappRadar’s data revealed that Frogana, Retardio Cousins, and SMB Gen2 were the top three NFT collections on Solana over the last 24 hours.
As per Sanrtiment’s data, SOL’s NFT trade count spiked last week. Its NFT trade volume in USD also increased over the past few days.
Source: Santiment
AMBCrypto’s analysis of CRYPTOSLAM’s data revealed that Solana also witnessed an increase in its NFT sales volume last week. To be precise, the number grew by 8%.
However, not everything looked favorable. For instance, SOL’s number of NFT sellers dropped by 59% last week. A similar declining trend was also noted in terms of SOL’s number of NFT buyers, as the figure dropped by more than 66%.

Source: CRYPTOSLAM
SOL turns bullish
While all this happened, Solana bulls buckled up as its daily chart remained green.
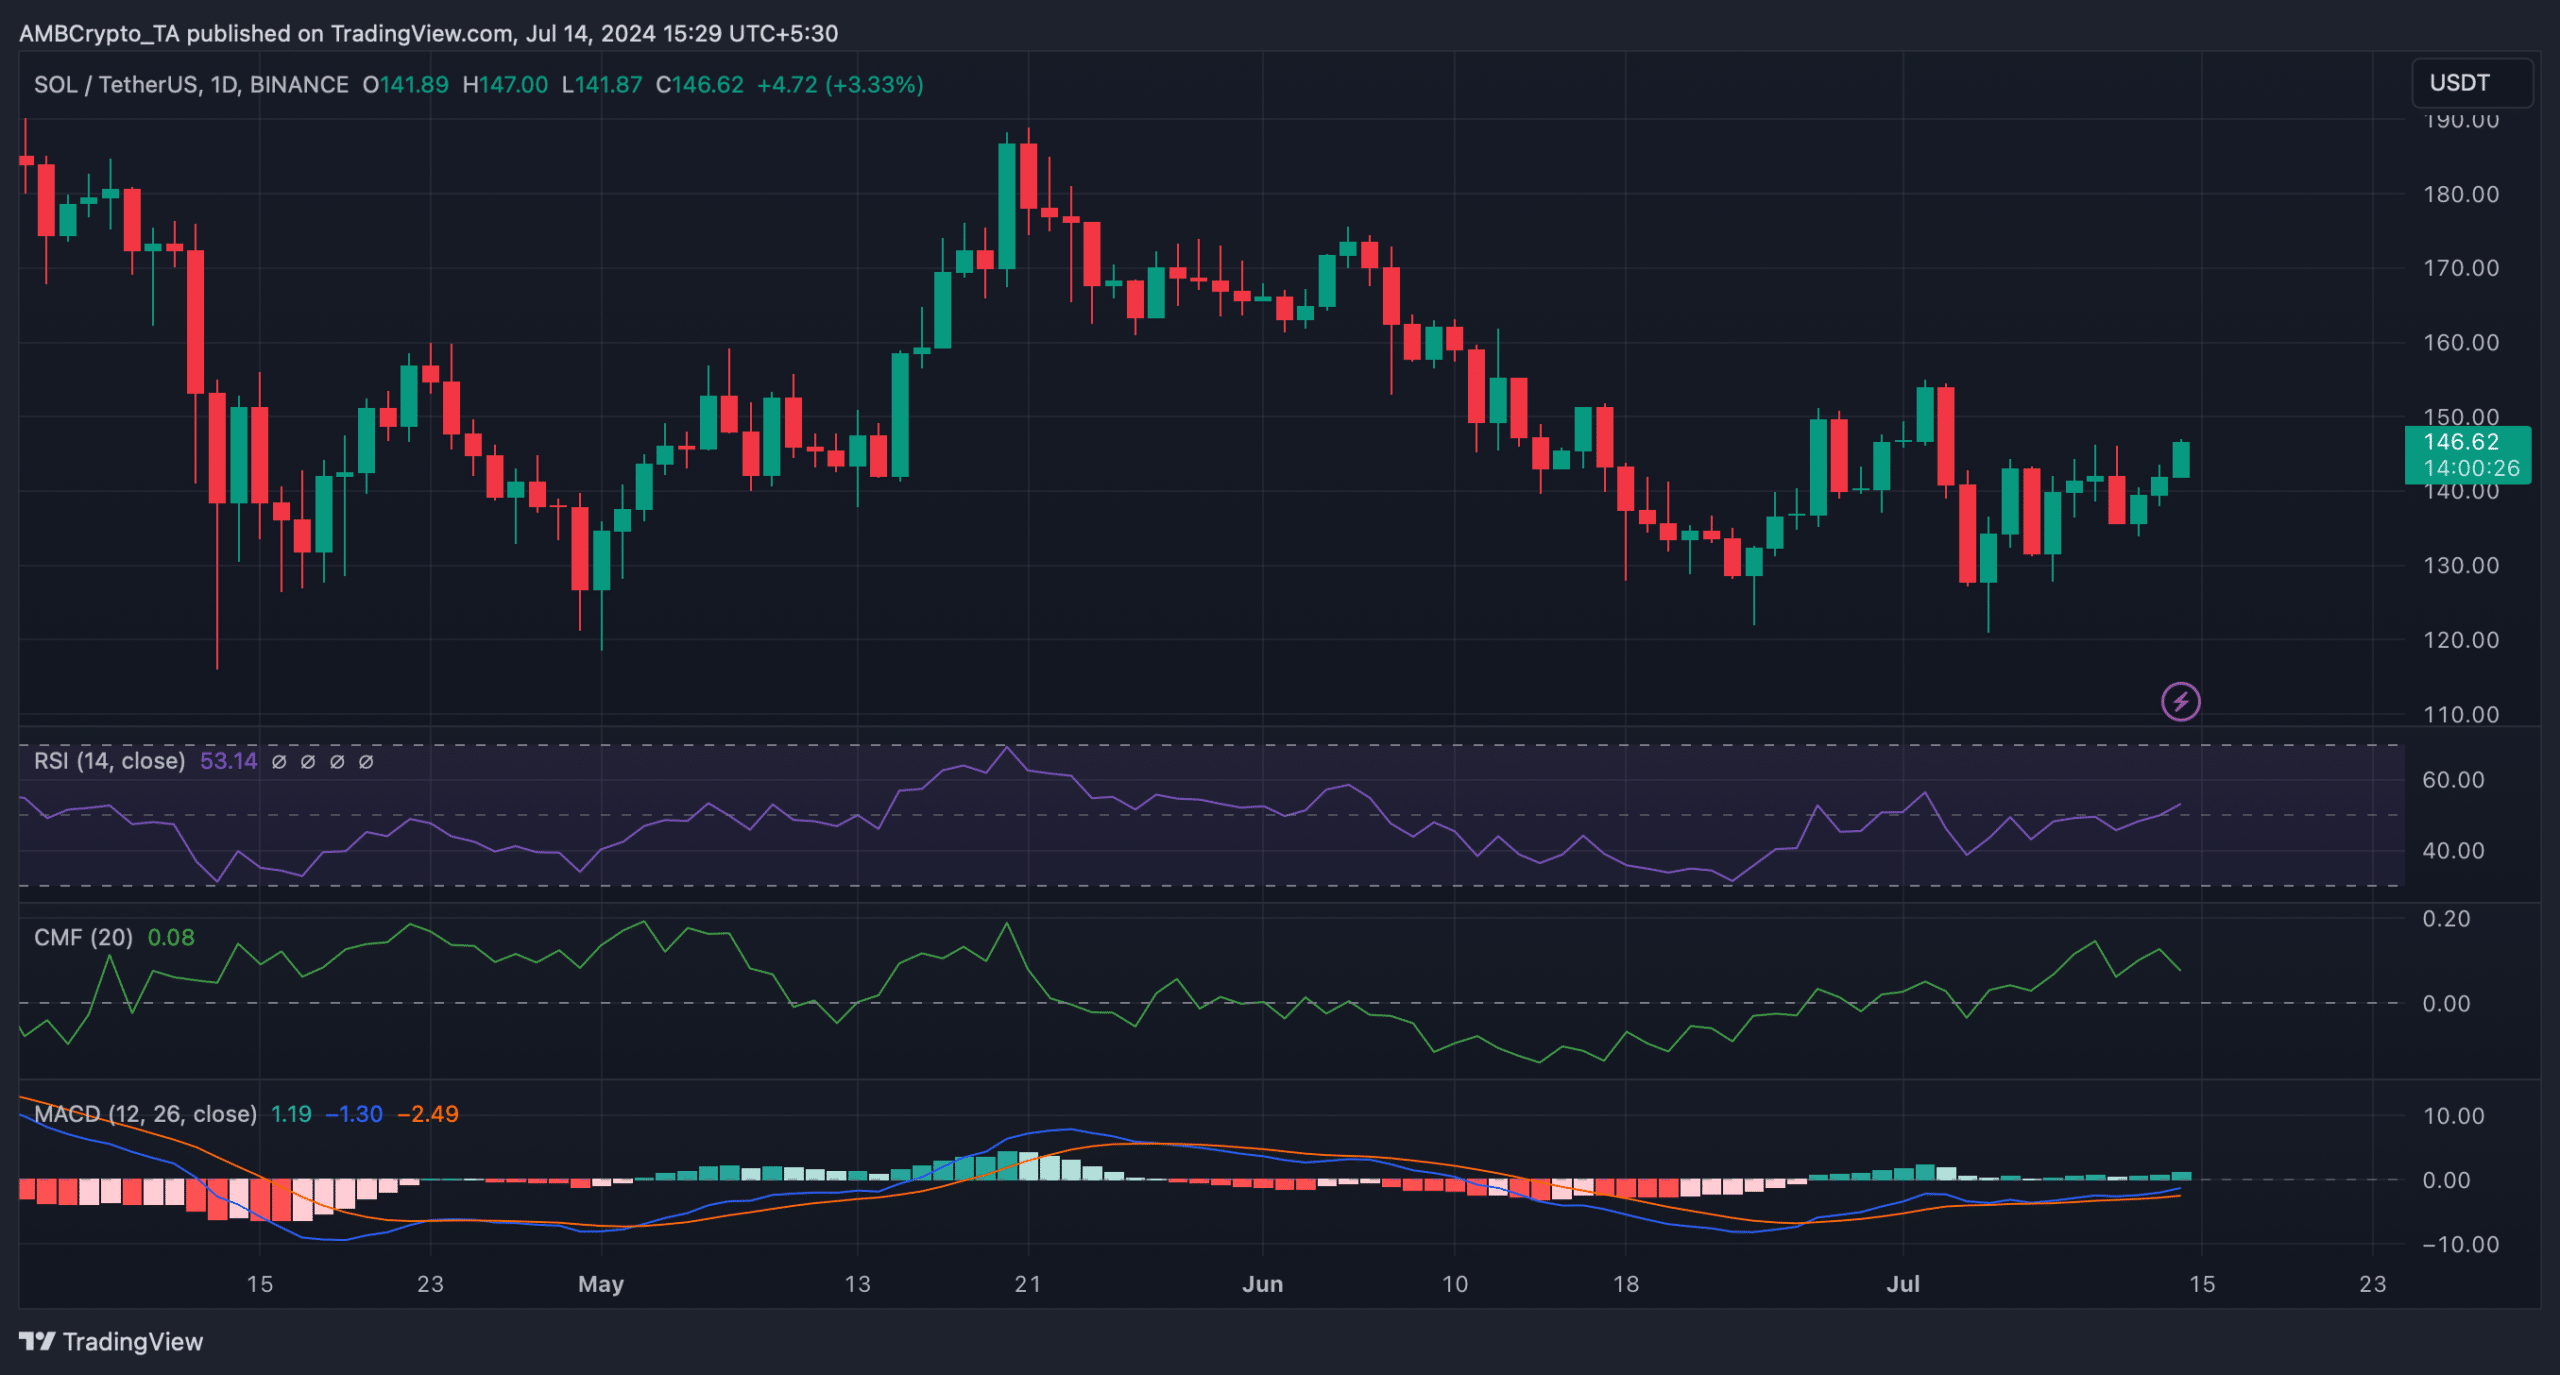
According to CoinMarketCap, SOL’s price increased by over 4% in the last 24 hours. At the time of writing, SOL was trading at $146.67 with a market capitalization of over $68 billion, making it the 5th largest crypto.
However, SOL might soon lose its bullish momentum. At the time of writing, SOL’s fear and greed index had a reading of 68%, meaning that the market was in a “fear” phase.
Whenever the metric hits this level, it suggests that the chances of a price correction are high.
Therefore, AMBCrypto planned to have a look at SOL’s daily chart to better understand what to expect from the token. As per our analysis, the technical indicator MACD displayed a bullish advantage in the market.
Is your portfolio green? Check out the SOL Profit Calculator
The Relative Strength Index (RSI) registered an uptick and was headed further up from the neutral mark, indicating a continued price increase.
Nonetheless, the Chaikin Money Flow (CMF) went southward, which could restrict SOL’s price from moving up in the coming days.

Source: TradingView
This news is republished from another source.


